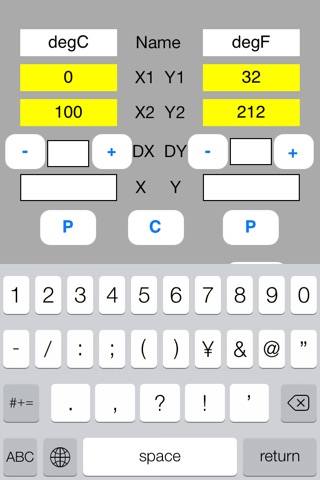
Linear Calibrator is to be used for a linear data converter such as Celsius to Fahrenheit Converter, and data correction for experimental data.
Suppose that two kinds of data, X and Y, are linear relation and that the data of two points, (X1, Y1) and (X2, Y2), are known. The data of arbitrary point is calculated from the following formulae.
Y =(Y2 - Y1)x(X-X1)/(X2 - X1)+ Y1
X =(X2 - X1)x(Y-Y1)/(Y2 - Y1)+ X1
This software is a simple sheet to execute the above calculation.
(Example-1) Celsius to Fahrenheit Converter
Change 25-degree Centigrade into Fahrenheit.
Linear Calibrator solves this in the following three steps.
//Step 0: Preparation//
Prepare calibration data.
They are as follows.
P1 0 degC 32 degF
P2 100 degC 212 degF
//Step 1: Definition//
Enter the calibration data into the sheet.
NameX = degC, NameY = degF
X1 = 0, Y1 = 32
X2 = 100, Y2 = 212
//Step 2: Calculation//
Enter 25-degree Centigrade to degC data field.
Touch out P button of degC data field.
Converted data, 77.0-degree Fahrenheit, is displayed in the degF data field.
In case of sequential conversion, DX button can be used.
For example, conversions from 30, 35, 40, 45, 50, … are as follows.
Increment is 5.
Enter 5 in DX text.
Touch out the +DX button.
Converted data, 86.0 -degree Fahrenheit corresponding to 30 (=20+5) ℃, is displayed in the degF data field.
When the +DX button is touched out continuously, the next conversion can be obtained.
(Example-2) Data correction for experimental data
It is known that the oxygen gas concentration (%) and the oxygen sensor output (mV) have a linear relationship. We have calibrated the oxygen sensor at the following two points.
P1 0 % 2 mV
P2 21 %21 mV
When the oxygen sensor output is 4 mV, how much percent is the exact oxygen gas concentration?
//Step 0: Preparation//
Prepare calibration data.
They are as follows.
P1 0 %2 mV
P2 21 %21 mV
//Step 1: Definition//
Enter the calibration data into the sheet.
NameX = %, NameY = mV
X1 = 0, Y1 = 2
X2 = 21, Y2 = 21
//Step 2: Calculation//
Enter data to the mV data field and touch out P button of this field.
The 2.21 % of exact gas concentration data is displayed.
C button clears data, and enables to calculate next data.
[Buttons]
//P button//
P (put) button inputs data and execute calculation.
When the data field is blank, it is interpreted as illegal data.
When the data field is illegal character, it is interpreted as zero value.
//-DX button//
The -DX button subtracts DX value from X value, executes the P button.
//+DX button//
The +DX button adds DX value to X value, executes the P button.
//-DY button//
The -DY button subtracts DY value from Y value, executes the P button.
//+DY button//
The +DY button adds DY value to Y value, executes the P button.
//C button//
C (Clear) button clears data.
[Color change]
After the P button execution, data are shown in the following colors.
Input data:Blue color
Output data:Green color
Uncalculated data:Red color
The uncalculated data is not output. The former data is remains unchanged in this data field.


